Posts
How I Find Country Pairs for Mean Reversion Strategy
How I Find Country Pairs for Mean Reversion Strategy As mentioned in my previous post here, the first step for a mean reversion strategy is to conduct some background quantitative research.
Step 1 First, I use a pair trading function to loop across 800+ country pairs (created from combination function),
pair_trading = function(stock1, stock2, trade_amount, finance_rates, start_date, end_date, prop_train, enter_z_score, exit_z_score){ ## More codes here ## Return this key_info = list( ticker = c(stock1, stock2), start_date = start_date, trade_table = data_trade, sharpe = c(sharpeRatioTrainset, sharpeRatioTestset), half_life = half_life, profits = data_trade_stats, max_drawdown = c(table.
Research to Production Pipeline for Mean Reversion
Research to Production Pipeline for Mean Reversion
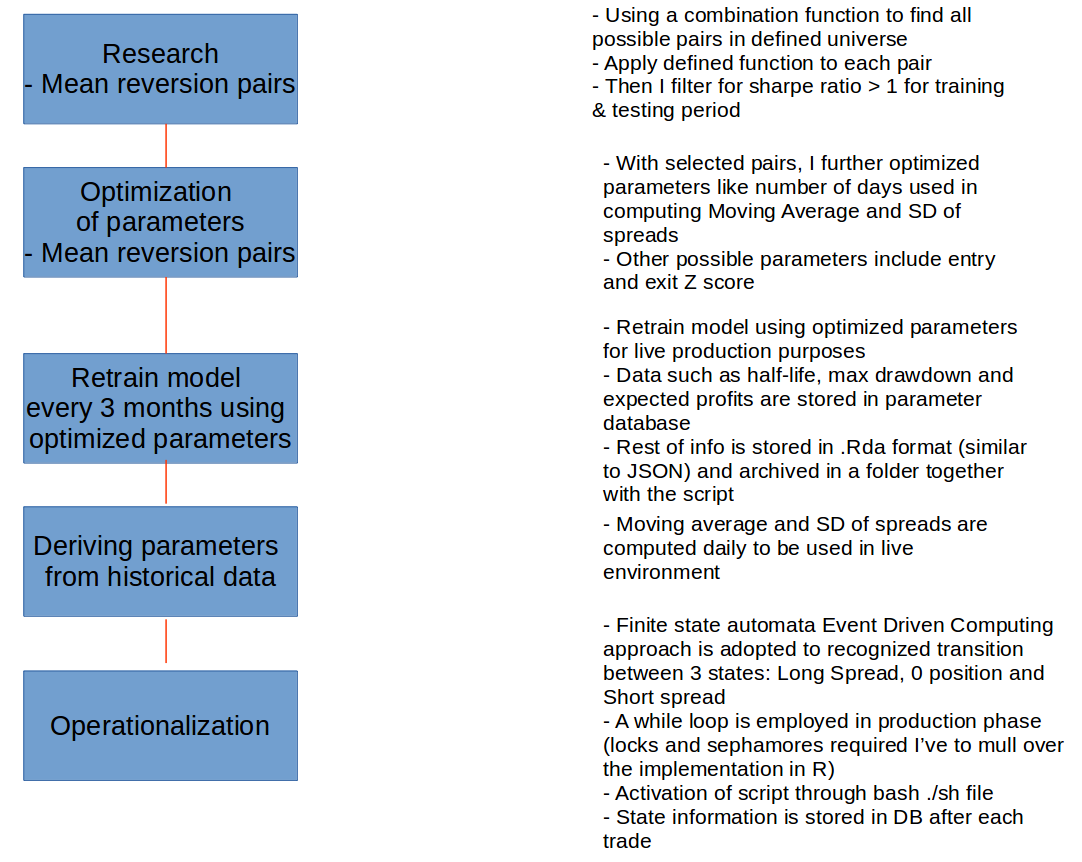
Here is a high level overview of something that I’m working on.
I’ve been grappling with the finite state automata Event Driven Computing transitions and I kinda sorted it out for production use.
Prototype Pair Trading Strategy for Silver ETFs
In these 2 weeks, I’ll deploy my pair trading algo strategy into my server.
I modified the code below from a renowned quant trader, Ernest Chan. The basic idea is to find z-scores through moving average & moving SD of spread. If it’s more than absolute of z-score, I will either short or long the spread depending on the polarity.
In the backtesting below (using a pair of silver ETFs as an example), I assumed a hypothetical amount of 10,000 dollars per trade.
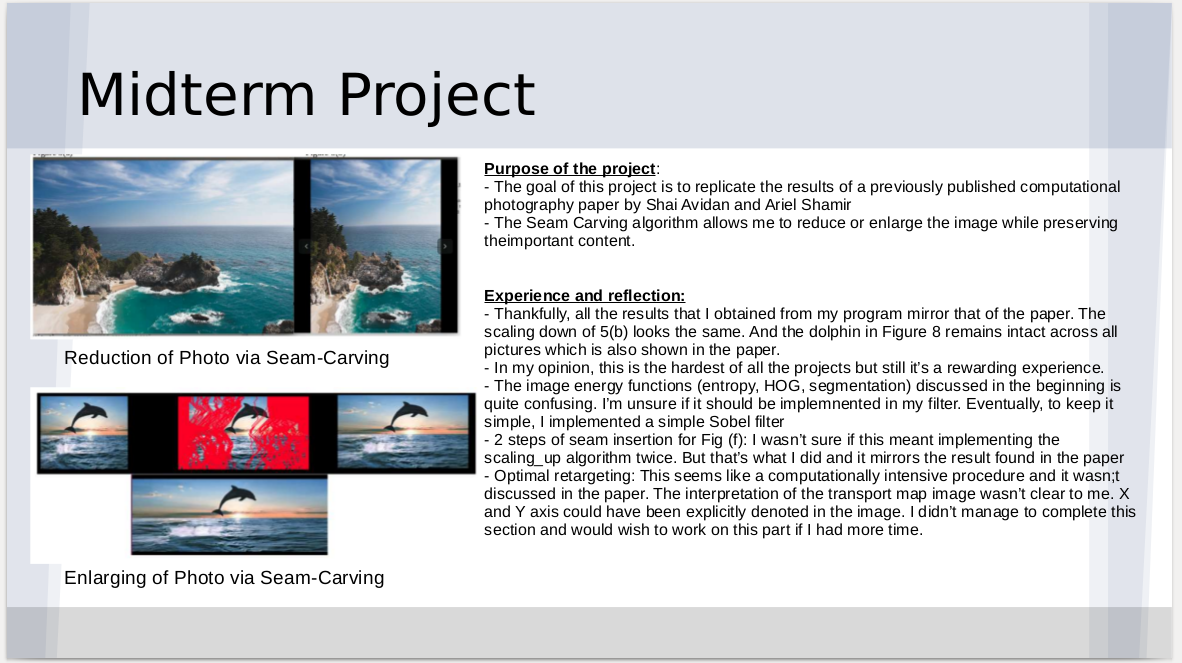
Summary of My Computational Photography Module From Georgia Tech Computer Science Masters
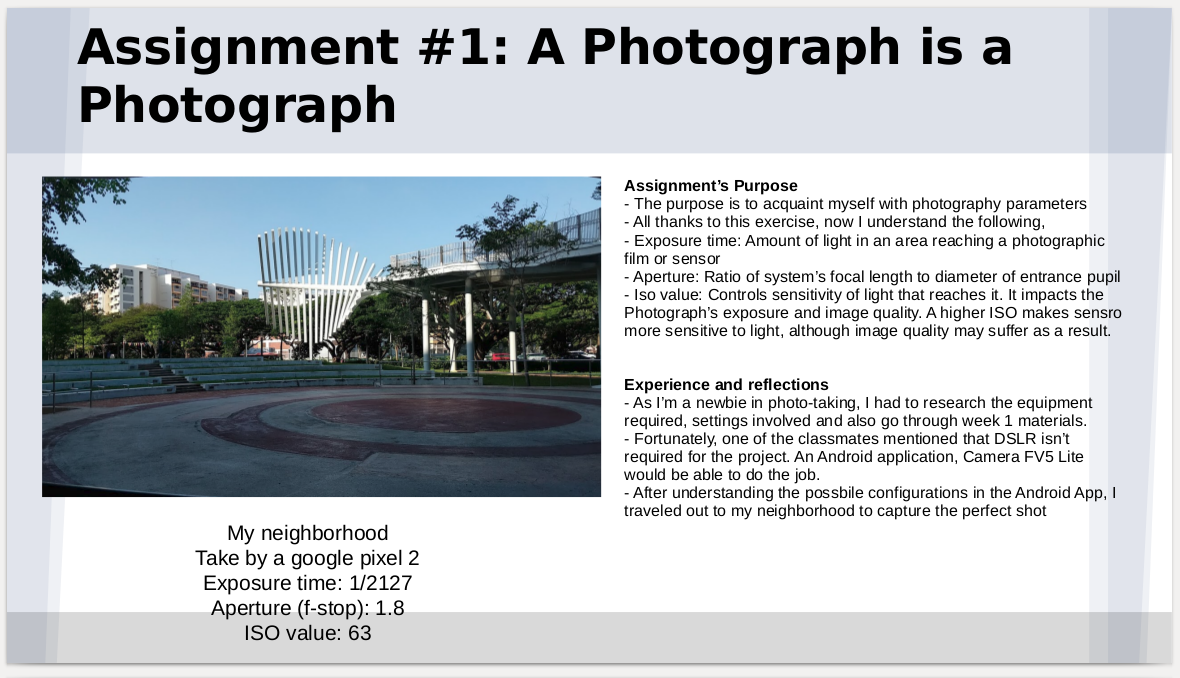
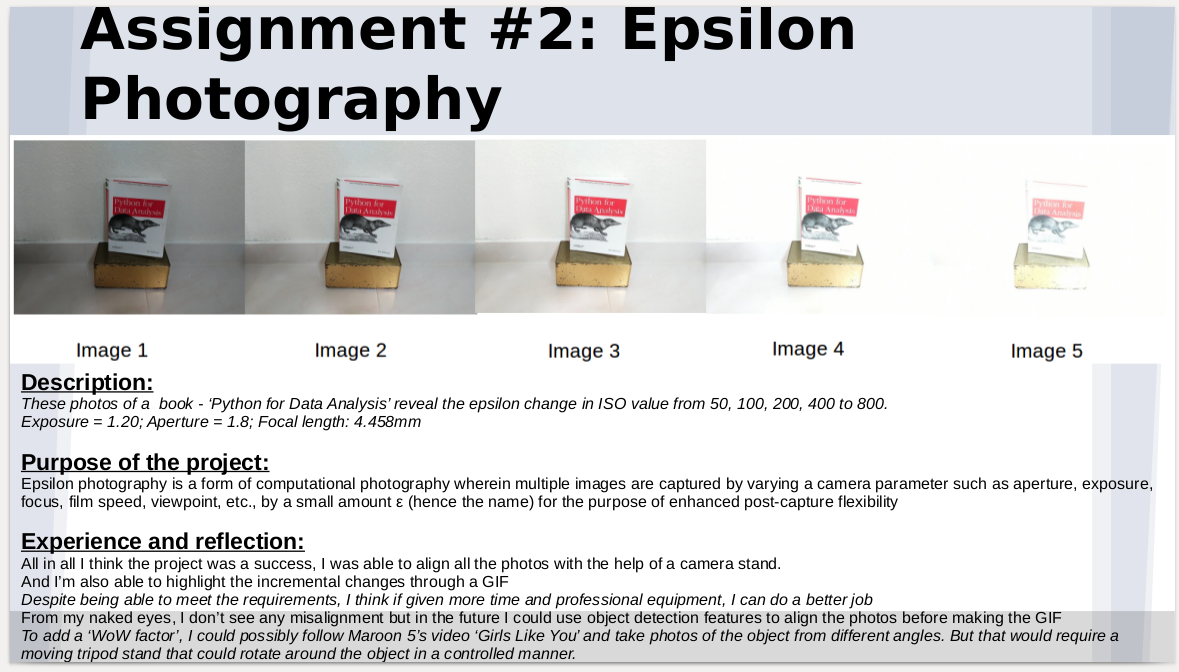
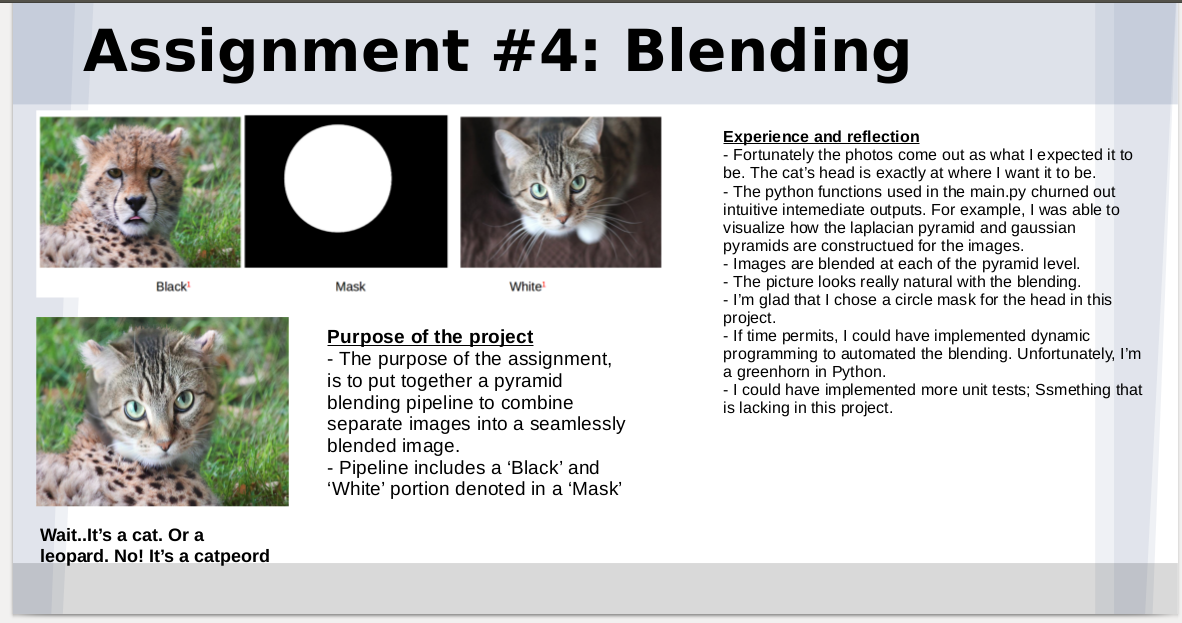
For what’s worth, here is a summary of what I went through for my Georgia Tech Computer Science Msc Computational Photography module.
And it’s really painful but rewarding!


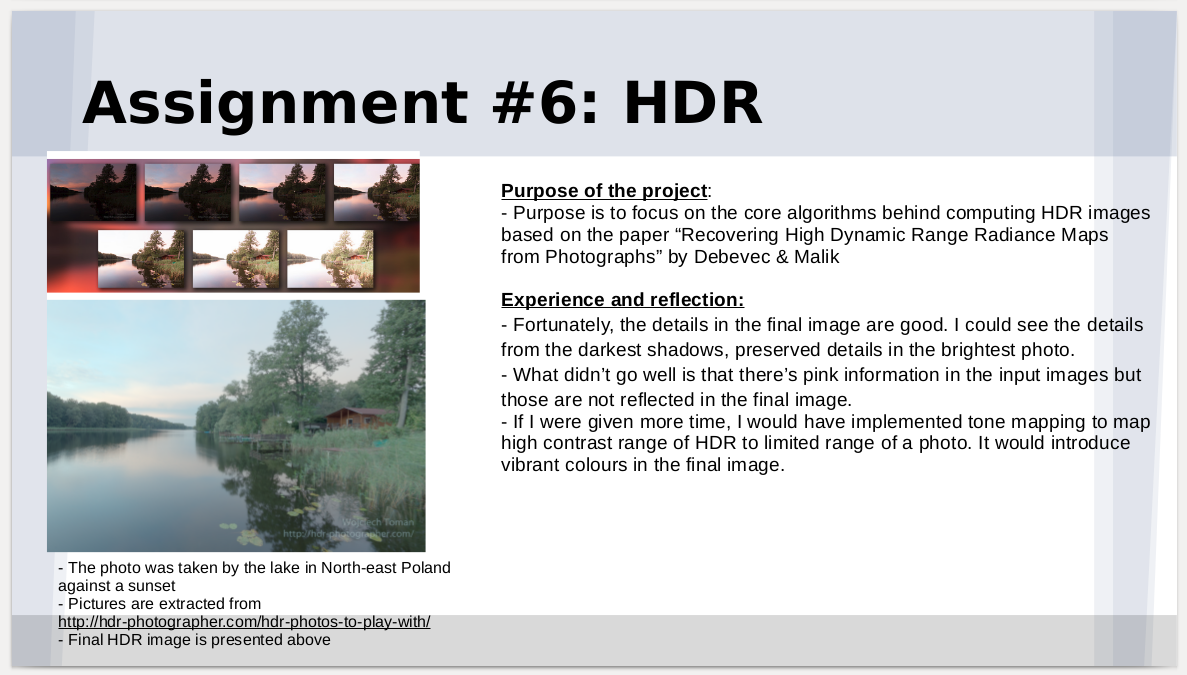

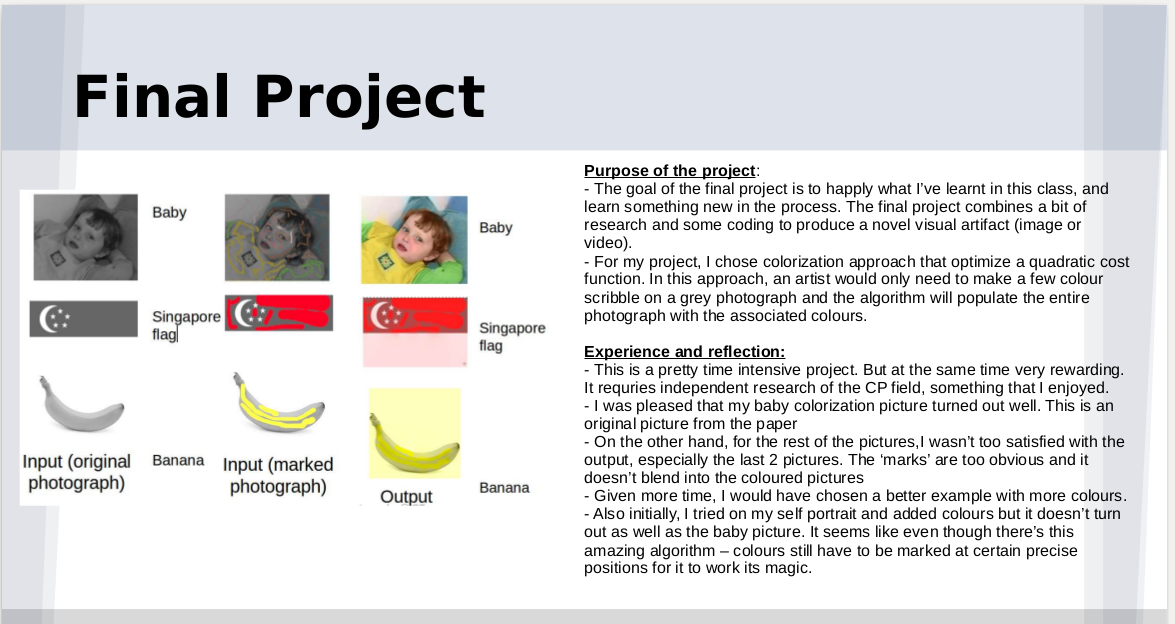
Colorization
Colorization The following is a high level project pipeline of my Computational Photography Colorization report. The project scope involves minimizing a quadratic cost function. An artist would only need to make a few colour scribble on a grey photograph and the algorithm will automatically populate the entire photograph with the associated colours.
1.Input: I first read in the image using imread function.
2.Find the difference: Next I compute the difference between the marked and grey scale image.
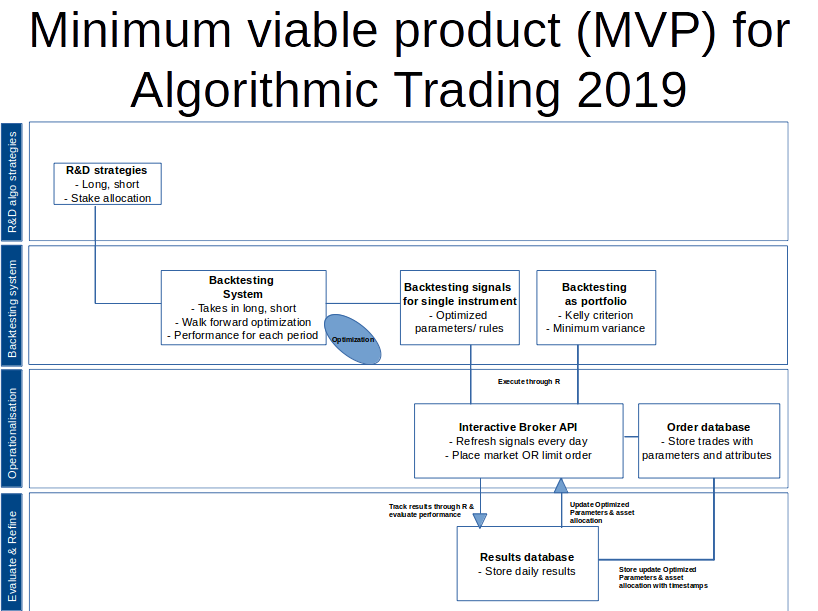
Architecture and Process Flow for My Algorithmic Trading
Project that I will be working in 2018-2019
Seam Carving
Snippet of my Seam Carving Report from my Msc Computer Science Georgia Tech’s Computational Photography module Besides removing of streams, we can also add streams. We identify k streams for removal and duplicate by averaging the left and right neighbours. The computation of these averages is done by convolving the following matrix with the images’ colour channels.
kernel = np.array([[0, 0, 0], [0.5, 0, 0.5], [0, 0, 0]]) In the implementation of my scaling_up algorithm, I first remove k streams (depending on ratio set by user) and recorded the coordinates and cumulative energy values of the original picture in each removal.
R package: Decomposing a Position Into Exchange Rate and Non Exchange Rate Effects
Decomposing a Position Into Exchange Rate and Non Exchange Rate Effects If you are someone with a stake in foreign positions, this package I wrote here may be a useful tool to help you understand the impact of foreign currency on your positions. For instance,
If you are an investor, you may use it to analyze impact of exchange rate on your investment positions. If you are in the treasury department, you may wish to analyze the impact of exchange rates on your bonds.
Shift Share Analysis Package I developed
Shift-share Analysis Package I developed During my career, I often have to deal with compositional & within group effects. For instance, the employment rate fell by 3% across 2 period. How much of it is due to an increase in employment rate within the sub-group and how much of it is due to compositional shift (for example ageing population).
A formal way to explain these effects is known as shift-share analysis.
Automated Email Notification of my ETF watchlist
I wrote an automated email notification code to send out my daily ETF watchlist in csv - an extension of my ETF watchlist project here. I figured out that people will not visit my site. So why not blast out the watchlist instead:)
And if you are interested in the code. Here you go.
#Steps for sending watchlist library("rJava") library('mailR') source("./R/emails.R") # Write the content of your email msg <- paste("Hey there, I'm sending this ETF watchlist that is updated as of ", "\n", as.